In the recent series of articles on Bowls Central called How to Fix your Bowling Green we discovered a great deal by simply taking a soil profile sample. It’s amazing how much information we can glean from such a basic operation. From that we saw how we can fix many of the most common problems on the bowling green.
Taking that on a step further I want to look closely at some of the pointers we can use to carry out a Performance Evaluation of the Bowling Green and this starts with a look at the essential turf qualities required for consistent and predictable high performance.
These can be summarised as follows:
• The turf should have a low, creeping growth habit with erect leaves
• There should be tolerance to close mowing (<5 mm)
• There be a high shoot density
• The grass should have a fine leaf texture
• The turf as a whole should be uniform
• There should be freedom from excessive grain, mat or thatch
• The turf should have a good recuperative potential
• The turf should have good disease resistance
• There should be good wear tolerance and colour
There might be a few unfamiliar terms in that list, but don’t worry about that, all will become clear as we progress. Even if the terms are familiar to you, some of them might seem a bit wooly, but they are measurable factors in most cases. Some, like colour, can of course be subjective, am I seeing the same green as you are? However, the majority of these factors can either be measured and/or compared to known data allowing for a more clinical and objective evaluation process.
**********************
Let’s begin by trying to understand what, at first, can seem subjective beyond belief, but nevertheless is a critical influencer of green playing performance, Uniformity.
Turf Grass Uniformity
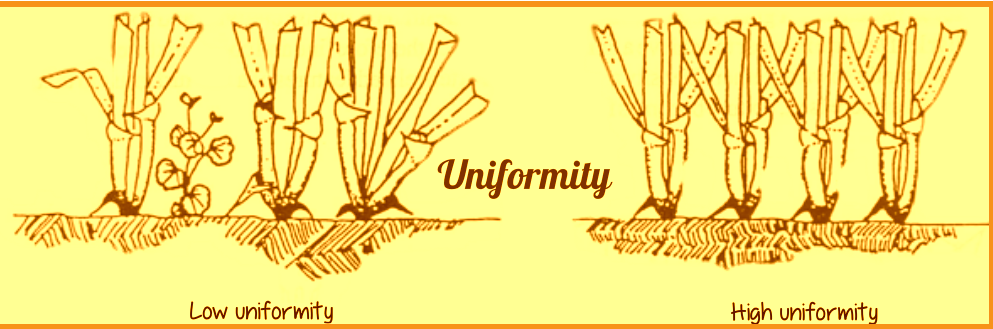 Turfgrass Uniformity is a visual estimate of how even the turf surface appears. This might sound like a basic or even simplistic way to appraise something as technical as a bowling or golf green, but it remains one of the most important skills a greenkeeper can master.
Over recent decades, greenkeeping has been made ever more complicated by the proliferation and the associated need for sales of new products and equipment. While much of this is useful and has made the greenkeeper’s job easier in many ways, there has been a tendency to trust in technology at the expense of the basic skills of greenkeeping. Like all professions, greenkeeping becomes more intuitive with experience and the greenkeeper’s feel for the turf is an important skill that develops over time.
Regardless of how much of a feeling you have for the turf, the fact remains that high quality, high performance turf will usually be uniform in appearance.
Factors that detract from Uniformity include the presence of bare areas, weeds and scars from disease, disorders and insect damage. Weeds in this sense could include unwanted grasses like Yorkshire Fog, Annual Meadow Grass or Rye Grass. Even the desired grass species can cause problems with Uniformity when they develop irregular growth habits, causing grain or excessive thatch.
Poor Uniformity will tend to present as patchy growth or areas of varying colour and density on the green. Any component of the turf surface (grass, weeds, bare patches, thatch etc) can and will often have a negative effect on green performance.
At this stage we are simply making a visual estimate of the uniformity of the turf and one feature of the grass itself that has a disproportionate influence on uniformity is Turf Grass Density. However, density isn’t a one trip pony, as the relative density of the shoots produced by turf grass plants also influence other key turf performance measures such as green smoothness, speed and trueness.
In addition to this, shoot (and overall turf) density is the main attribute of grass plants that helps them to dominate an ecological niche, crowding out competition from other species.
Turf Grass Density
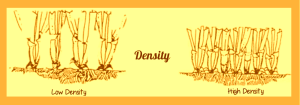 Turf grass density can be measured quantitatively by counting the number of shoots or leaves per unit area, but, as a useful way to spend your time, I don’t recommend it, for reasons that will soon become clear . Simply stated, higher density is good and low density is less desirable. Good density in the turf will provide increased competition against invading weeds and weed grasses. Moss can become a problem on any turf area with low density, taking advantage of any spaces in the turf, so maintaining turf density actively guards against this problem too.
Turfgrass Density is actually a measure of the relative numbers of grass shoots in a given area and this can vary widely among turf grass species and cultivars. The shoot density of any one turf grass cultivar also varies widely depending on the cultural maintenance regime (aeration, mowing etc), the surrounding environment and the time of year. The rate of seeding and even the relative success of early establishment can be important influences in determining the shoot density of the non-creeping turf grass species. Of course soil moisture, close mowing and Nitrogen fertilisation generally increase the shoot density, but it’s easy to tip the balance and overdo these to the detriment of turf quality as we’ve seen in the Circle of Decline. One of the highest turf grass shoot densities occurs in bentgrass greens, which can produce over 1,700 shoots per square decimetre (10cmX10cm). This is equivalent to nearly 165 billion bentgrass shoots per acre! That’s a lot of shoots! Please take my word for this and stop counting immediately.
For now it will be enough to make a visual appraisal of how dense your turf is.
• Are there clearly visible spaces in the turf?
• If you brush the turf upright with your hand, can you see bare soil between the individual grass plants?
Have a look and also check to see if the density differs across your green.
• Can you come up with reasons that this might be happening?
• Can you see what physiological attributes of grass plants influence Density?
It might not seem obvious at first but it makes sense that narrower leaves/shoots need less room than broader ones.
So at the risk of stating the obvious, might we assume that grass plants with narrower leaves will be more adept at creating denser turf?
That leads us nicely on to Texture…
Turfgrass Texture
Texture simply refers to the width of the individual grass leaves in the sward or more importantly the general or average width of leaves or shoots in the sward. Again, at this stage of our appraisal we are making a largely visual judgment although this aspect can be measured more precisely if you have the time or the inclination.
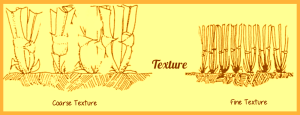 The preferred texture for fine turf playing surfaces like bowling greens is a medium-fine to medium texture, ranging from 1.5 to 3 mm in width. In un-mown swards, the grass plant leaves will tend to broaden with age and you might be surprised to see just how different, say a bentgrass plant will look when left to grow naturally as compared to a closely mown plant on a green. It’s an experiment you can easily try by planting some seed in pots and cut them to different heights regularly.
Different species vary in leaf texture and there can even be considerable variability within the same species or cultivar. This variability isn’t necessarily inherent, but a result of the greenkeeper’s direct influence. The cultural practices we employ such as mowing, nutritional level. Mowing frequency and height. For example the leaf texture of creeping bentgrass and annual meadow grass can be reduced by as much as 50% simply by lowering the height of cut from 37.5 mm to 7.5 mm. Of course this refers to regular mowing and not a one off cut.
Although Annual Meadow Grass (AMG) remains undesirable in fine turf surfaces, where it dominates the sward already, many greenkeepers maintain a very fine surface consisting mainly of AMG. This is achieved over a long period of time as the AMG adapts to take advantage of the prevailing conditions imposed by the greenkeeper. These greens can, however, suffer badly in adverse conditions and can look terrible out of the main growing season.
Although it is desirable to allow the green to grow on a little in winter, it is not beneficial to maintain a mowing height much above 8mm, as the texture can start to broaden significantly and of course other issues with soil surface micro-climates in longer grass can occur, leading to increased disease outbreaks etc.
Turf Density and Texture are closely related features of a fine turf grass sward. As density increases, texture becomes finer. And of course, as texture (leaf width) becomes finer, the possibility of a higher turf density is introduced.
However, even with predominantly fine textured leaves in the sward, there are other growth factors that can still negatively impact turf uniformity and density and these are mainly a consequence of the varying growth habits of different grass species and growth traits within species and cultivars.
Turfgrass Growth Habits
Grasses are the most abundant and widespread plants on Earth and as a result they vary greatly in their evolutionary development. This has resulted in a wide range of physical and growth characteristics between and among species. In fine turf management there are 3 main growth habits we need to consider. Each of these growth habits can be present in a stand of fine turf. Let’s look at them individually:
Bunch Type
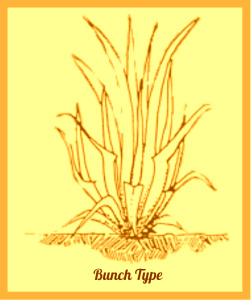 Bunch-type turf grasses, spread exclusively by tillering. Tillering describes the way in which grass plants put up successive shoots after the first shoot is established. Each shoot originates in a grass plant crown, which is the name given to the structure at the auction between roots and shoots. In bunch type grasses, by definition there is only one crown per plant so shoot density, in as far as it can be achieved with type of grass is achieved by encouraging the plant to continually put up more shoots.
Grass plants naturally put up more shoots in response to injury from grazing or in our case, mowing. The singular function of every shoot is reproduction, which is achieved when the shoot grows to full size, produces a flower, which in turn eventually will produce seed. Each time a shoot is injured (and therefore unable to complete reproduction) a new shoot is initiated, so regular mowing encourages increased tillering and more shoots mean higher density.
Of course, this doesn’t change the fact that all of these bunch type shoots are originating from the same crown and therefore can’t influence turfgrass density outwit the immediate vicinity of the parent plant.
Where seeded at sufficient rates, bunch type grasses can form a uniform turf. However, at low seeding rates where growth proceeds from isolated individual plants, small clumps develop, resulting in a non-uniform surface. Clumpiness in a turf is characteristic of a perennial ryegrass, Chewings fescue, annual meadow grass and other bunch-type turf grasses.
Although some of the finer grasses such as Chewings fescue have bunch type characteristics, they are usually mixed with other spreading types (such as as slender creeping red fescue) in order to achieve a dense and uniform turf surface.
Other turfgrass species and sub species have the ability to spread by means other than tillering and these fall into 2 main categories, plants with Stolons and plants with Rhizomes.
Rhizomatous
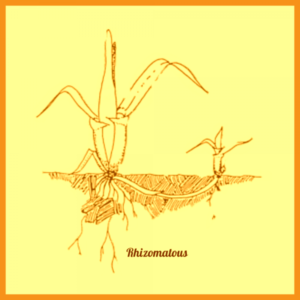 Rhizomatous turf grasses spread by below ground shoots called rhizomes. At points along these underground shoots, nodes (crowns) are created and from each of these crowns a new plant will grow, which, after a short period of establishment will become independent and start to produce its own rhizomes so that the effect of this spreading growth habit becomes exponential and many new plants are created at points far removed from the original parent.
Due to the emergence of these rhizome terminals at positions away from the mother plant, strongly rhizomatous turf grasses tend to form uniform turf with aerial shoots orientated in more or less upright position. Difference in stem elongation and leaf orientation among cultivars influence turf grass quality and close-mowing tolerance. Common turf grass species are Smooth Stalked Meadowgrass, Creeping Red Fescue and in the warm season zone, Seashore Paspallum.
Stoloniferous
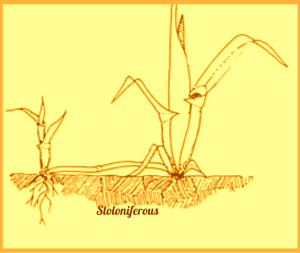 Stoloniferous turf grasses spread above ground using lateral shoots called stolons in very much the same way that rhizomes do below ground. Agrostis stolonifera or Creeping Bentgrass is one of the most vigorous turfgrass varieties and although it is used to create some of the densest and smoothest greens around the work it has a few drawbacks.
Turfs formed from stoloniferous turf grasses quite often have aerial shoots orientated in a predominantly decumbent position. creeping bentgrass sustained at relatively high mowing heights (7 mm – ¾ in) forms a distinctly grainy turf with most shoots growing horizontally. We call this lateral growth and the effect on turf is called grain, which can have a strong negative influence on green speed and trueness.
The varying growth habits of our turf grasses can bring both benefits and further challenges. This weekend, can you take time to look at your green to see if you can identify any of these growth habits in your turf? One that is most easily spotted is annual meadow grass which is a bunch type and creates distinctive light green clumps in many greens.
As we’ve seen, the practices used by the greenkeeper can positively influence the growth patterns of turf grasses in favour of dense, uniform turf. The smoothness of that turf surface ultimately dictates how the green plays, so it will be useful to look a little more closely at what Green Smoothness actually means.
Turf Grass Smoothness
If you want to know why your green has started behaving badly, this is the first place to look. Have a look at images taken using a microscope below:
These images show the relative finish left on individual grass leaves with different types of mower setting. Please note that neither of these mowers was blunt or unserviced. The difference comes down to the way the mowers have been set.
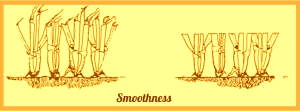 Smoothness is a component of turf grass quality that is particularly important on bowling and golf greens. Greens must be free of obstructions or depressions that might deflect the roll of the wood or golf ball. One of the key contributors to compromised smoothness is bad mowing and by that I mean mowing with poorly adjusted and/or poorly sharpened blades. This can cause a tearing action on the grass leaf which can lead to a ragged and discoloured end on the leaf. Amplified over millions of plants/shoots, this can lead to poor performance, particularly in terms of trueness.
Trueness is a functional measurement of green performance that we will be looking at in more detail later that describes the level to which the ball deviates horizontal (snaking) during its traverse over the green. Bowling and putting quality is reduced where leaf ends are not smooth. Leaf growth habit and smoothness can be evaluated by visual estimates or the trueness and distance of a golf ball or jack rolling.
Until recently there was no quick or accurate method of quantitatively measuring this component of turf grass quality. Although specialist tools existed to help the greenkeeper look closely at the quality of cut and finish on the turf it wasn’t really possible to correlate this with actual green performance. Now, though there is an increasing interest in Objective Measurement of turf playing performance and this has resulted in the development of a new wave of specialist instruments to help us evaluate overall turf surface performance including previously subjective aspects like green smoothness and trueness.
More on that later, but now let’s take a step back from this increasingly technical subject and look at how greenkeepers have instinctively, maybe even subconsciously, evaluated the condition of turf over the years.
Here is the obvious quality measure that almost every greenkeeper uses, even if unwittingly sometimes. Colour can be a useful evaluation component as long as we understand the likely causes of differentiation in colour of turf.
As radiant energy from the Sun contacts the turf, certain wavelengths are absorbed and transmitted while other wavelengths are reflected. Reflective wavelengths are perceived by the human eye as the colour of the turf. Colour can be one of the best indicators to the general condition of a turf.
For example, a loss of green colour may indicate deficiency in a particular nutrient (usually Nitrogen), damage by disease or insects, or insufficient or excessive water.
Colour also differs among grass species and even among cultivars of the same species. A mid to deep green is the preferred colour for most greenkeepers, but a lack of green-ness doesn’t always indicate a problem. For example on the links land, the finest of turf can appear almost completely brown or beige in the summer, with little or no detriment to the overall playability or health of the turf.
There is a wide variation in preference among greenkeepers, but over watering and over fertilising to achieve a particular look should be avoided. The main aim is to keep the grass healthy.
Functional Properties
So far we have looked mainly to visual clues to ascertain the likely performance attributes of the turf. To some extent, these visual clues can only be appraised subjectively; one man’s deep green might not be the same as another’s after all. Although it might be interesting, I don’t think we have enough time to get any deeper into anthropology or philosophy here!
In the face of this potential for subjectivity what can we do to take our study of green performance further? Fortunately there are a series of functional turf qualities that we can look at in order to come up with a more tangible assessment of the factors that influence green performance and now seems like the right time to investigate those.
For now we’ll take a closer look at each of these performance characteristics in isolation, but later, in a follow up article we’ll look at some of the latest developments in the industry that can help us to put numbers on these factors.
The functional turf qualities we can appraise are as follows:
• Rigidity: how able are grass shoots able to stand erect.
• Elasticity: the ability of grass plants to bounce back after impact.
• Resiliency: a feature of the turf as a whole, including the thatch layer.
• Yield: how much grass are we cutting and what does this tell us?
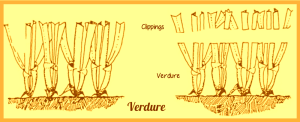
• Verdure: what’s left behind after mowing?
• Rooting: the vigour, mass and depth of rooting.
• Recuperative Potential: how hardy are your grass plants and how well do they recover from environmental stresses?
Let’s look at each of functional characteristics in depth:
Rigidity
Turf Grass Rigidity is an assessment of the grass plant’s ability to resist compression from downward forces like feet, machinery and play. It is closely correlated with the relative turgor of the internal cells of the plant. We discussed the processes involved in keeping plants turgid in an earlier article here.
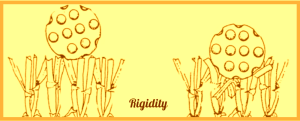 Turgor (and by default, Rigidity) is influenced by the chemical make up of the internal parts (cells) of the plant and particularly by the water content. Temperature and therefore growth and relative density of the turf can also influence Rigidity.
Rigidity is more accurately a measure of the turf than the individual grass plants and is closely linked to wear resistance, which varies with species and cultivar. More rigid or harder turf will be more resistant to wear.
As always, the best way we can influence Rigidity in the turf is to keep the plants healthy through correct nutrition and water provision.
At this stage in the process of performance evaluation it must be stressed that the finer bent and fescue grasses (particularly browntop bents) will always out perform annual meadow grass in this respect and as a result we should be striving to encourage these species’.
Over fertilising and over watering will tend to cause lush and therefore soft growth and cause plants to be more susceptible to disease outbreaks. Conversely, allowing the turf to dry out too much will result in a reduction in turgor in plants and lead to a turf that is not rigid enough and susceptible to wear.
Rigidity isn’t just a “nice to have” feature; it influences other aspects of performance such as green speed and the trueness of the green.
At this stage it’s still going to be a personal, greenkeeper’s feel for how things are. Is your turf dense and standing upright when you rest the palm of your hand on it? Does it feel like it will stay like that or be easily squashed flat?…
…and will it stay flattened or bounce back into shape?
Elasticity
Which brings us nicely onto turfgrass Elasticity, which is a measure of how able the turf grass is to bounce or spring back to an upright position after being pushed down flat by a ball, a bowl, a foot or a mower for example. When the pressure is removed, how readily do the grass leaves spring back to their upright position?
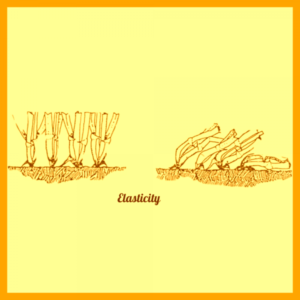 Turgor, or the grass plant’s relative content of water, the strength of cell walls and the general health of the plant will all influence this. In dry conditions when transpiration is rapid, it might be difficult for the plants to remain turgid throughout the day and some loss of elasticity will result. In extreme dry conditions where the plants have been affected by drought, the leaves can become brittle and break completely. This of course will result in permanent damage to the plant.
In winter it is important that traffic of all sorts stays off the turf if the grass is frozen. When frosted grass is walked on, you will usually see black footprints on the turf after it has thawed and this is the result of breakage and bruising to the grass plants. This is also permanent and to make matters worse will leave the damaged plants susceptible to attack from fungal diseases such as fusarium at a time when they have few resources to fight back.
As far as green performance is concerned, elasticity is an important characteristic. Poor elasticity will cause inconsistencies in surface smoothness, trueness and speed and can be a contributor to the infamous bad rink on bowls greens.
So far we’ve discussed attributes and characteristics of the plant, but we know that dealing with symptoms in isolation rarely make any difference for the better. So, let’s move on to look at a characteristic of the whole turf that can make or break a green.
Resiliency
Resiliency is such an important measure of turf performance as it can influence everything from green speed and trueness to how well your green can withstand turf skinning and even disease outbreaks.
 Up until now we’ve looked at issues that are largely functions of the turf grass plants themselves. Resiliency, however, is a measure of the combined effect of grass plants and the medium they are growing in or what we call the turf.
Turf resiliency is a measure of a turf’s capacity to retain it’s surface character during and after shock or stress. In this case the shocks and stresses we are mainly concerned with are those from play such as bowling or golf, including the downward pressure from bowls, balls feet and maintenance traffic.
As we have seen already, the grass plants contribute to resiliency in terms of their rigidity and or elasticity. Laterally growing grass shoots and leaves can also aid resiliency of the turf as they absorb some of the pressure that would otherwise impact on the turf as a whole.
Although the grass plants are important in achieving the right level of resiliency, the soil medium in which they are growing is largely responsible for the overall resiliency of the green surface. Thatch in particular plays a big role in achieving the desired effect. The ideal is achieved with a dense, tight sward of fine bent/fescue grass growing on a sandy loam with a maximum depth of thatch of around 5mm. Good aeration and drainage with freedom from major areas of compaction all go towards making the green resilient enough to receive the delivery of shots without compressing too much which would sap the energy of the shot.
When thatch is excessively thick it will sap the energy from bowls and golf balls and create uneven runs and significantly reduce green speed and trueness.
On heavily compacted turf the effect will be a turf that is too hard, making shots hard to control and in many cases resulting in shallow rooting grasses that contribute to skinning at the heads of bowling greens and deep pitch marks on golf greens.
Soil type and texture, thatch and compaction control and good turf grass health lead to a green that offers the perfect balance of resilience and speed.
The Circle of Decline LINK is marked out by the extremely low resiliency of the turf resulting in a wet, spongy surface that is easily marked by footprints, pitch marks and skinning.
Yield and Verdure
Sometimes the things we see every day become so familiar that we stop noticing them and this can be the case with the most obvious of performance signals on the green. We can learn a lot from just being a bit more observant of the every day activities we get involved in as greenkeepers.
There are two aspects of green maintenance that sound so obvious that they are easy to dismiss:
• How much grass comes off when you mow? This is called Yield
• And how much grass is left after you mow? Which is called Verdure
It might sound ridiculous to make up special words like Yield and Verdure for fundamental factors like this, but they are important and give us much more information than we might first realise.
Yield
This is the measure of how much material comes off when we mow the green. Of course we aren’t interested in the yield in the same way that a farmer might be. Our job isn’t to grow as much grass as possible; our job is to grow dense healthy turf that supports the preparation of the green surface to a high performance level, consistently throughout the season. Turf scientists might take the clippings, dry them and weigh the remaining dry tissue matter to come up with an accurate measure of Yield in kg/Ha, but my old boss at my first greenkeeping job had a much more straightforward and instant way of monitoring this. When I returned to the maintenance shed after cutting 18 golf greens in the morning he would simply ask; “did you get much grass?”
 Unscientific as that may sound, it’s as good a measure as any to an experienced greenkeeper who treads the same piece of ground every day in life. The subtle nuances of Yield Fluctuation (the increase or decrease in boxes of grass removed to you and me) can tell you a lot about your green’s condition.
Assuming that everything else such as mowing height, sharpness of mower, weather conditions and timing of cut are roughly the same, we can make a judgement of the condition of the green relative to previous cuts we’ve made, whether that was yesterday or last year at the same time. But what can we ascertain from this?
Nutrition
Increasing yield is common after Nitrogen fertiliser has been applied. Fertiliser applications, particularly when using granular fertilisers tend to have a distinct life span pattern and the green will go through a growth pattern after application. For example a few days after application of fertiliser like this it will be common for the yield to increase steadily day after day. At some point after the first flush of growth, yield will level off and stay roughly the same for several weeks. Then it is likely that yield will steadily reduce until a new application of Nitrogen is made and the pattern will repeat. Being able to judge when the next application needs to be made is a skill picked up by greenkeepers over time and relies a lot on watching the grass box filling up. By having this feel for what’s happening in terms of growth patterns, you can form a better understanding of the right fertiliser program, application rates and frequency of application for your green at any given time.
Moisture
Another key contributor to yield will be the level of plant available moisture in the soil at any given time. Yield will decrease as this dips below optimum and will increase as you get closer to field capacity. There’s a close connection with nutrition here too as fertiliser needs a good amount of soil water for the nutrient ions to be able to get into the soil solution where they can be taken up by the plant roots.
Cultural Practices
The other non-mowing cultural practices you carry out on your green will also influence yield. Jobs such as scarifying and aeration of any kind will have the effect of introducing oxygen to the soil which will increase microbial activity, releasing nutrients which might increase yield.
Of course, the object is to try to create a steady growth pattern that allows the green to recover from the rigours of play and maintenance and to exhibit all of the other key components of performance we have looked at so far. Measuring yield even by just counting the boxes of grass collected every day is a great starting point in getting a feel for your green’s performance and the effect that your work has on it over time.
Verdure
Verdure is a measure of the green plant material that is left after mowing. Oh come on John, I just call that grass, I hear you say, but Verdure is just a little more complex (and useful) than that.
For example in any turf grass species, turf resiliency and rigidity will increase when you leave more tissue on the plant i.e. raise the blades. This will generally increase wear resistance too. Grass will generally be healthier and more robust at higher mowing heights and that is why I recommend raising the height during drought conditions and of course in winter.
What lies beneath?
Up until now we’ve discovered how to evaluate performance by simply looking for visual indicators on the turf and by gauging some of the functional attributes of grass plant communities when they form turf, but no appraisal of this kind would be complete and certainly wouldn’t make any sense in ecological terms without examining the growing medium in more detail.
 All of the functionality and therefore performance of the bowling green depends on healthy turf and turf is of course not just grass plants. Turf is a construct of a healthy grass plant community containing millions of individual plants, growing in a medium that is suited to sustaining healthy growth and reproduction. The medium is, of course the soil our greens are built on; but what is soil?
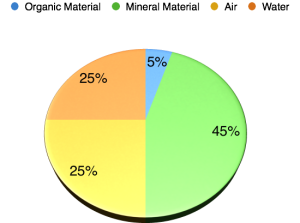
If you look at the pie chart on the left you will see the proportions of what can be thought of as the perfect soil.
Mineral Component
You will see that 45% of the soil is made of Mineral material. The mineral component of soil is made up of a mixture of 3 main groups and these are Sands, Silts and Clays. A suitable mixture of these is important to the soil’s performance as they dictate the soil’s ability to provide nutrition and moisture to the grass plants and to support suitable drainage properties. The mix of sand, silt and clay defines the soil’s texture.
Organic Component
The organic component will ideally make up around 5% of the soil’s volume and consists of living organisms, micro-organisms and dead, decomposing and already decomposed plant tissue (humus). The organic material is added to by the plants themselves as they produce thatch and the soil organisms break this down to release plant nutrients.
50% Nothing
Then there’s the remaining 50% of the soil to look for, but if you do, it might cause you some confusion, because in the ideal soil the remaining 50% of its volume will equate to nothing at all. In fact it is 50% space, or soil porosity to give it the correct name.
Ideally half of this space will be made up of small spaces between soil particles called micro pores and large spaces called macro pores. The micro pores hold the soil solution which is a mix of water and plant available nutrient ions and the macro pores provide air space and this is where all of the drainage occurs after heavy rain. This air space keeps the soil well oxygenated so that it can sustain a huge population of soil microbes; around 1 billion in a teaspoon of soil.
Objective Measurement
Now, after our delve into the turfgrass characteristics that contribute to playing surface performance we’ll conclude with a brief explanation of the actual green performance parameters that can be measured objectively.
In appraising any bowls or golf green we are ultimately looking for particular levels of performance in 3 main areas and these are Green Speed, Surface Trueness and Surface Smoothness. It won’t surprise you to know that it doesn’t end there, however. Turfgrass ecology and playing surface performance as subjects are a bit like Russian dolls. Once you achieve a level of understanding, there is usually a deeper layer to uncover. For now though, let’s concentrate on this layer.
Speed, Trueness and Smoothness.
The performance of your green comes down to 3 distinct factors and these are as you’ve guessed, Green Speed, Green Surface Trueness and Green Surface Smoothness. Until fairly recently we didn’t have any realistic way to put numbers on these, but we live in times when objective measurement is critical in many sporting disciplines and the technology to make proper objective appraisal of green performance is now at hand, in as much as you can objectively measure an ever changing, living entity like a golf or bowls green.
Measurements are always a snapshot in time.
Green Speed
This might sound obvious, but green speed is fairly easy to evaluate, but up until now it seems to have been made unnecessarily difficult by the bowling world. Green Speed plays a big role in the overall enjoyment of the game, but it’s not the only thing that does. For the sake of completeness, green speed is a measure of how much effort is required to make a bowl or golf ball travel across the green.
Until now, bowls has relied on the timed wood, which never be described as objective. Meantime golf green speed has been measured using the Stimp Meter, which although far more objective than the bowls method, is still stuffed with opportunities for human error to creep in.
The timed wood method measures the time in seconds it takes a wood to travel from the mat to a jack 27 metres away. As this wood is delivered by hand and timed with a stopwatch, there is a lot of room for human error. The theory is that the longer the wood takes to travel to exactly 27 meters, the faster the green is, due to lighter effort being required to deliver it the required distance. The speed is declared in seconds.
Golf’s Stimp Meter meantime relies on a measurement of distance travelled by a golf ball being released from the Stimp Meter (a grooved ramp) when it is raised to an angle of 20 degrees. The further the ball rolls, the faster the green is deemed to be. This measurement is stated in feet, with measurements between 8 and 12 feet being deemed suitable for play usually. This method still requires human input to raise the ramp to the desired angle, so is not free of human error either.
Green Trueness
Trueness of the green surface is one of the most confusing subjects I have come across at bowling greens, but it is relatively simple to get right and some of the attributes we have discussed in this article influence it greatly. In particular, our ability to produce a tight, dense, sward with good rigidity, elasticity and smoothness has a great influence on green trueness.
This is a measure of how much side to side movement the wood or ball encounters on its journey over the green.
Deviation from the straight line is called snaking and this is caused by discrepancies in the surface ranging from Annual Meadowgrass (Poa annua) seedheads to disease scars and everything in-between.
Green Smoothness
Like Trueness, green smoothness is thought of as a bit of a black art, but again, it is simple to understand and deliver for our players. However, the factors that influence this are not always as obvious as we are led to believe by some people in the industry. It has nothing to do with sand, long batons of wood or road rollers for example. Green smoothness is simply a measure of how much vertical disturbance the wood or ball encounters on its travel over the green, or bumpiness to you and me!
This movement is referred to as bobbling and is influenced by many factors, but thatch management is the greatest of these. Thatch is by far the biggest contributor to bumpy greens and the unevenness caused by excessive thatch and the constantly mobile nature of this makes top-dressing as a cure for bad levels futile.
Measuring Performance
The good news is that all of this can be assessed and more or less accurately quantified. I say more or less, because it really depends on how deep your pockets are. There is now a great deal of interest in surface playing performance in the golf world and the scientists are making great inroads in convincing high end golf facilities that they need to invest great wads of cash in assessing green performance. This is good for the people who make the instruments and also for the consultants who charge an arm and a leg to carry out the work. For the poor old greenkeeper, however, it is possibly another barrage of evidence to hit him over the head with, so it’s probably best to be on top of it. Having an understanding of this subject can also help you to fine tune your maintenance schedule to get the best results from your greens
To undertake the evaluation of speed, smoothness and trueness in the way golf is going, costs a minimum of, I would hazard a reasonably educated guess at £3000 for the equipment.
However, it needn’t be expensive to get a good understanding of green performance and to build up a picture of this over time, but before we get into that, you might find it useful to discover what these methods are and why they are deemed so important in the golf world these days so I’ve written another article that will give you a flavour of what is being measured and how it’s being measured.
Final points and further reading
Included within this article is a full powerpoint presentation which, as a member of the Bowls Central online community you are very welcome to share a link to with anyone you feel would benefit from this information. You are also free to embed the presentation on your club website if you so desire. If you need any technical help with this, please don’t hesitate to get in touch.
As mentioned earlier in this article, this subject area can be compared to the traditional Russian doll, when one layer is exposed to the light it becomes apparent that a deeper, more complex layer exists below. In this case it is the practical aspect of Objectively Measuring Turf Performance that is exposed as requiring further explanation. With this in mind I’ve written another article to delve a bit deeper into current best practice for measuring turf playing surface performance.
What an excellent and comprehensive article on assessing bowls and golf greens – congratulations.
Thanks for this John. It’s amazing how much you can take for granted without actually looking at what you have.