
For Starters
Your Bowls or Golf club might occasionally have a greens soil analysis done. Some clubs insist on doing this annually, others only when prompted by a supplier or when a particular problem occurs on the green. If you’ve had greens soil analysis done or are considering one as a means of informing your greenkeeping regime, this guide will help you to better understand the results.
Greenkeeping is an amateur science all rounder’s dream as it can help you to apply your knowledge of Chemistry, Physics and Biology to understand what’s really going on under your feet. The typical greens soil analysis report focusses quite deliberately on the Chemistry element of this, but soil Physics and Biology play a very big part in the eventual outcome of your greens soil analysis.
Greens Soil Analysis reports come in many shapes and sizes. Some include a comprehensive breakdown of all key nutrients, some only the ones deemed most important by the instigator of the test. A routine greens soil analysis report will usually measure the soil pH and in some cases might even point out some of the basic physical characteristics of the soil such as sand content.
Regardless of the detail of the report, there are some key factors that are essential to know, if the report is really going to help you in your maintenance.
Physical Analysis (Particle Size Distribution)
 Not every greens soil analysis will include information about the physical attributes of the soil, but occasionally basic information will be included such as the percentages of Sand, Silt and Clay and a description of the soil texture such as Sandy Loam. When this is included as part of a chemical soil analysis it will almost certainly have been done using a process called Laser Diffraction.
Laser Diffraction Method
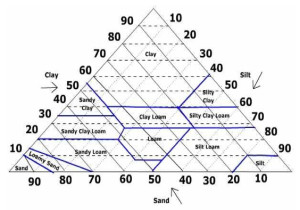
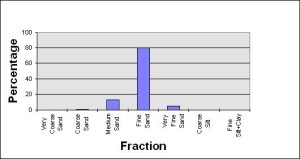
Using this method, the soil sample is suspended in water and passed through a flow cell. The flow cell is positioned in the path of a laser beam and the particles of soil passing through the cell cause the laser light to be diffracted. The amount of light that is diffracted is dependant upon the size of the particle in its path. Small particles cause greater diffraction than larger particles. By measuring the diffraction pattern of the laser beam it is possible to predict the size and relative population of particles in the sample. Once the Particle Size PSD has been determined the soil will be given a textural class according to the Soil Texture Triangle, but you won’t receive a detailed breakdown of Particle Size Distribution. For greens rootzones, this will hopefully be in the Sandy Loam sector of the triangle. Soils identified as Loamy Sand or Sand are already too high in sand content and will need remedial work to build up humus and improve nutrient, moisture and rooting capability usually.
Pipette by Sedimentation Method
To get an accurate measure of the actual Particle Size Distribution (PSD) the sample will need to be subjected to a more thorough test using the Pipette by Sedimentation Method. In this method the sand is graded by fraction and removed from the sample by sieving, before the remaining fines are mixed to form a suspension with water. The clay and silt fractions are then determined by pipette sampling from suspension at different sedimentation times according to Stokes Law. This method is dependant upon the fact that the sedimentation rate of dispersed soil particles is proportional to their size. This will almost certainly not figure in your soil analysis unless you specifically asked for it, but is very useful in determining whether or not you should be adding more sand to your green.
The Main Feature
I included the above information on physical soil analysis merely as a pointer in case you have had a greens soil analysis report that includes it. For more detailed information on PSD or soil texture there is an article here that should be helpful.
However, the main purpose of this article is to help you understand the more routine greens soil analysis report you are likely to receive after it is suggested by your fertiliser supplier or greenkeeper. This type of analysis is intended to give you a snap shot of the current chemical condition of your green’s soil and will include a plethora of information, some of which can be very confusing. Let’s have a look at the main headings you’re likely to find in your greens soil analysis report.
pH
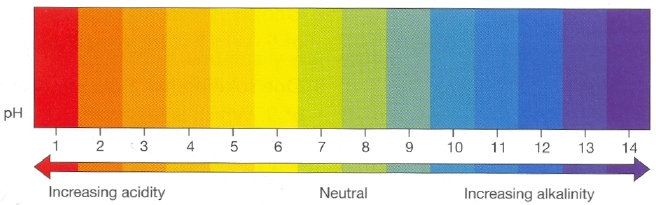
Everybody and their dogs think they know what pH means. The pH scale runs from 0 to 14 (very acid to very alkaline) and 7 is said to be neutral or neither acid or alkaline. Our fine perennial grasses like the soil to be somewhere between 5.5 and 6.5, slightly acid.
The general understanding of pH then, is that it tells you whether your soil is Acid, Alkaline or Neutral and to be fair this is true. However, the underlying chemistry is more complex than that and it’s useful to know a little about this.
What makes a soil Acid or Alkaline?
The “H” in pH stands for Hydrogen, so the pH section of your greens soil analysis is all about Hydrogen; in fact a measure of the number of exchangeable Hydrogen ions in the soil. An atom of any element has an equal number of protons and electrons. An Ion is simply an atom with an imbalance of these, usually due to losing or gaining electrons. This imbalance gives the ion an electrical charge which can be negative or positive in polarity. Acidic soil contains more hydrogen ions (H+) than neutral or alkaline soil. Positively charged ions like H+ are referred to as Cations (positively charged ions), whilst negatively charge ones are called Anions.
When working with biologically active soils, pH is often lower in the rhizosphere around the plant roots where bacteria metabolise on the root exudates and produce organic acids. However, in soils with an alkaline pH, (greater than 7), some nutrient elements such as phosphate and manganese can become unavailable to the plants or locked up as it’s sometimes referred to. You will often have been told that the optimum pH for turfgrass is 5.5 to 6.5 and there’s a good reason for this. Slightly acidic root zones favour the development of fungal hyphae in the presence of the correct food sources. Fungi are important for thatch degradation, disease suppression and perennial grass growth. The roles of the individual nutrient elements in plants are explained later in this article.
Cation Exchange Capacity (CEC)
Cation Exchange Capacity (CEC) measures the number of negatively charged sites there are in the soil for positive cations to bind to. This helps to hold nutrition in the soil and prevents nutrients from leaching out through the drains. These positive Cations include Calcium (Ca), Potassium (K), Magnesium (Mg), Sodium (Na), and of course Hydrogen (H). A higher CEC means more nutrients that can be held within the root zone without the risk of leaching out through the drains.
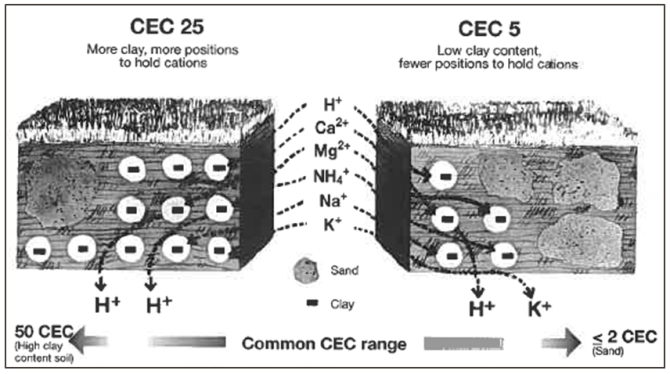
The negatively charged particles in soil are found in clay and humus which are usually lacking in high sand rootzones. The CEC may be increased by encouraging the correct soil microbiology to help thatch to degrade naturally, eventually converting it to stable organic matter (humus), or by adding minerals with a high CEC, such as Zeolite. Collectively, we refer to the negatively charged sites on clay and humus particles as the soil colloid.
CEC is measured in meq/100gm, which means milli-equivalents per 100 grams of soil. The relative number of positive charges for any nutrient ion will dictate how strongly it is held on the soil colloid and consequently, how easy or difficult it is to dislodge. For example the Sodium (Na) Ion is defined as Na+, a Calcium ion is Ca++ and one of the common Iron ions is Fe+++ and so on. The plus signs explain the number of missing electrons in the outer shell of the atom which are analogous with the number of charges it has available for bonding with other elements. Sodium (Na+) has one, Calcium (Ca++) has 2 and Iron (Fe+++) has three. In practice this means that 1 Iron ion will take up as much space as 3 Sodium ions on the soil colloid; its 3 plusses (+) occupy 3 negative (-) exchange sites on the available clay or humus.
New build, high sand rootzones usually have a low CEC (typically below 2 meq 100/gm), whereas the rootzone of your green would ideally have a CEC above 7 meq/100gm for efficient nutrient retention, but even that is low compared to more soily (my own scientific term:) soils.
Grass Roots and CEC
Your grass plants can only make use of the nutrient ions held on the soil colloid after they have been dislodged and become part of the soil solution taken in via Osmosis.
The clever part of this is that the root hairs of grass plants give off Hydrogen (H+) ions in order to exchange them for other ions. Loosely bonded ions (fewer +’s) are more easily dislodged than tightly bonded ones (more +’s)
Many bowls and golf greens soil analysis reports show a very high concentration of Iron (Fe+++), which has been routinely applied as lawn sand and as a constituent of fertilisers and moss killers for decades and remains in the soil due to the strong bonds it makes on the soil colloid with its fancy pants 3 +‘s.
***The Base Saturation*** (the bit with the stars that you must read!)
A thorough greens soil analysis report will include details of the base saturation of your soil. I’ve added little stars to the title of this section to show that it is probably the most important and informative part of your soil analysis…if it doesn’t include it, ask why!
If the Base Saturation is right, then CEC (in the presence of sufficient clay and humus) and pH are usually about right too. It’s not a guarantee, but I have also found that in greens where the Base Saturation graph looks good, then the underlying soil texture is often quite close to the ideal Sandy Loam texture also.
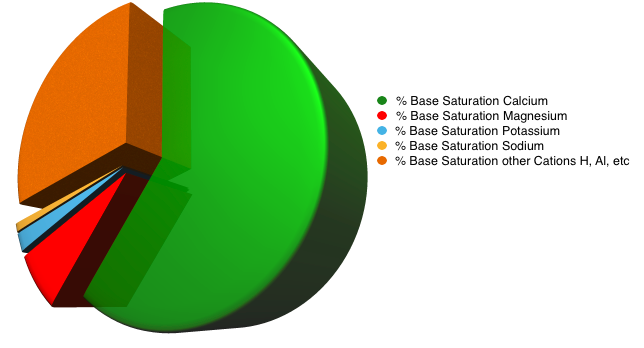
The Base Saturation is the percentage of total CEC occupied by the ‘Base’ cations such as Ca, Mg, K Na. The ratio of Ca : K : Mg when measured in parts per million (ppm) should be about 7-10 : 2 : 1 producing Base Saturation percentages of approximately 60-70% Calcium, 3-10% Magnesium, 2-5% Potassium, 0 – 2% Sodium. In most bowls and golf green rootzones the remainder are hydrogen (H) 10-15% and other cations (2-5%) providing a pH of 5.5 – 6.5. If the percent Base Saturation falls outside these ranges, nutrients may not be available to the plant. High levels of exchangeable Calcium can reduce the uptake of Potassium and Magnesium, likewise high levels of exchangeable Potassium can reduce the uptake of Magnesium.
If you get a nice Pie Chart of your Base Saturation it should look like the one below. If it doesn’t, you’ve got work to do…insist on a pie chart!
Electrical Conductivity
When our grass plants need to access all of these nutrient ions we’ve been talking about, they take them up through their roots in the soil solution (water + nutrient ions) by Osmosis. Osmosis is the name of the process in plant growth whereby water molecules move from an area of relatively low concentration (of solute nutrients) to an area of relatively high concentration (of solute nutrients) across a semi-permeable membrane (root hairs). In normal circumstances this means water (plus dissolved nutrients) moves into the plant from the soil.
The Electrical Conductivity of the soil solution is an indirect measurement of the salt content of the soil solution. As salinity increases plants become less able to extract water efficiently from the soil, which exacerbates any water stress conditions that may already exist. High electrical conductivity is caused by high levels of mineral salts in the soil solution, in the UK, this is usually due to prolonged use of inorganic fertilisers with a high salt index. Sulphates of Iron and Ammonia (commonly used fertiliser on greens for decades) have salt indexes of around 70, meaning that for every 100grams of fertiliser you apply, you also apply 70grams of salt!
In other parts of the world this could also be to do with high salinity in irrigation water from bore holes or similar. This problem can be helped by using organic, low salt index fertilisers and making more efficient use of irrigation water if this is an issue.
Severely high readings can lead in some cases to Osmotic Shock in plants where the process of Osmosis is reversed and moisture is drawn out of the plant due to the high concentration of mineral salts in the soil.
Soil Organic Matter
Soil Organic Matter is made up of the decaying remains of plants, microbes and animals, usually thatch in our case. Preferably, comprising around 5% of the root zone. It plays an essential role in supporting the microbial activity needed for nutrient retention and recycling, disease suppression and perennial grass growth. Physically, it provides good soil structure, drainage, enhanced root growth and promotes the water holding capacity of the soil.
Soil Organic Matter is determined using a test called the Loss on Ignition test…yes, they set is on fire (kind of)
Nutrients
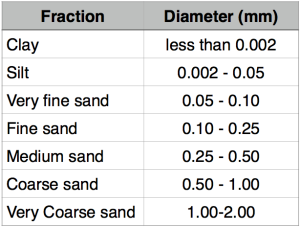
In your greens soil analysis report you will see some or all of the common plant nutrients mentioned. The remainder of the article explains their roles. They are split into 3 groups; the Primary Nutrients, Secondary Nutrients and Trace Elements.
Primary Nutrients (N:P:K)
Nitrogen (N)
We all know that Nitrogen is a very important plant nutrient and actually the most recognised requirement when we think of fertilisers. So it might seem confusing that it doesn’t even warrant a mention in your soil analysis report…what’s that all about?
Nitrogen is not usually measured in soils as it is very soluble and levels quickly change. Have a look at the, hopefully by now familiar, Nitrogen Cycle diagram below:
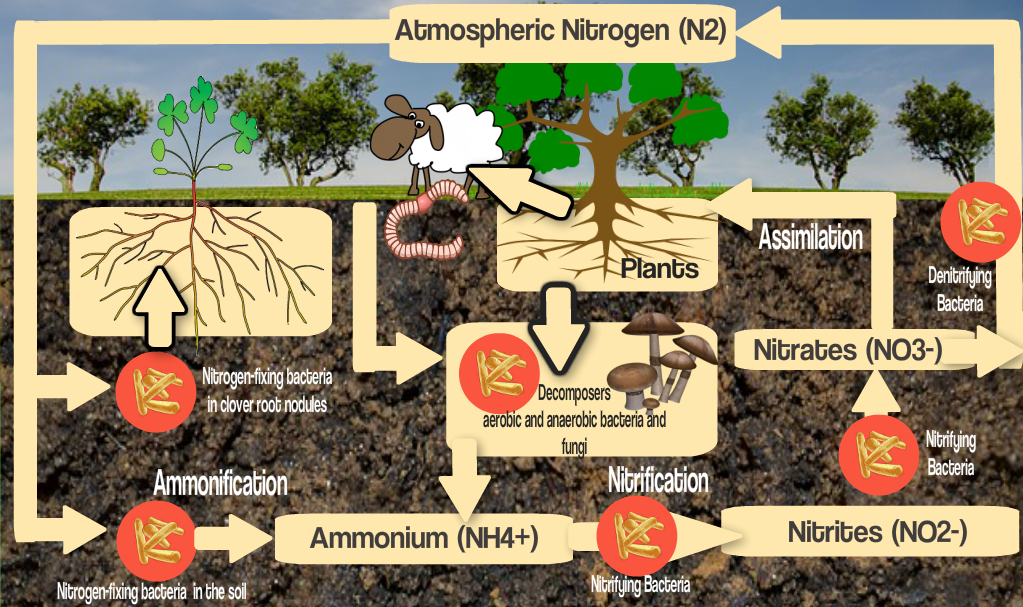
The most readily available form of Nitrogen in the soil is Nitrate (NO3–) and that minus sign tells us why it isn’t measured in the greens soil analysis. As an anion (negatively charged ion) it isn’t attracted to the soil colloid and in fact is actively repelled due to the clay and humus particles responsible for Cation Exchange being negatively charged too. This means that Nitrate is readily leached from the soil and partly explains why traditionally we have needed to add Nitrogen more frequently and in higher volume.
It can be applied in the form of organic or inorganic fertilisers. However, healthy root zones with an active soil food web may produce up to 50Kg nitrogen per hectare per year by converting the proteins and carbohydrates in root exudates to ammonium. Care should be taken to ensure excessive nitrogen is not applied. Excesses can cause soft, lush growth and dark green foliage, whilst leaving the plant susceptible to disease. Nitrogen deficiency is visible as yellow leaves, low sward density and poor, slow growth.
Phosphorous (P)
Phosphorous is critical in most plant metabolic and enzymatic processes essential for growth. Phosphate is needed for seed development and root growth. Phosphate is seldom lacking, except in new high sand content root zones but rapidly becomes unavailable without microbial solubilisation. Mycorrhizal and bacterial activity release phosphate for plant growth, so fertiliser additions are normally only required in early spring to repair winter damage and for new constructions.
Potassium (K)
Potassium activates the enzymes used in protein, sugar, and starch synthesis. Potassium is vital to many plant processes. The correct amount of plant Potassium improves drought tolerance, cold hardiness and disease resistance. Potassium ions are highly soluble and leach easily from soils so frequent application is often required. The ratio of Potassium to Magnesium when measured in ppm should be about 1.5 – 2:1.
Secondary Nutrients
Calcium (Ca)
Calcium should be the largest available nutrient for healthy grass growth, strong cell walls, nutrient availability and the correct pH. Plant available Calcium is often deficient in sandy root zones especially if excess Phosphate has been applied. Calcium may be applied in many ways; Calcium Carbonate CaCO3 when the pH should be raised, as Calcium Sulphate when pH should not be changed or lowered, as dolomitic limestone CaMg(CO3)2 when Magnesium is also required or as calcified seaweed. Liquid Calcium gives short term solutions only.
Magnesium (Mg)
Magnesium is important for photosynthesis because it forms the central atom of chlorophyll. It is an activator for many critical enzymes, essential for carbon fixation and metabolism. Low Magnesium decreases photosynthetic and enzymatic activity leading to premature ageing of the plant. Magnesium interacts with Calcium and Potassium on cation exchange sites. For maximum nutrient availability the ratio of Calcium to Magnesium should be in the range 7-10 : 1
Sodium (Na)
Sodium in small quantities is a plant nutrient that aids metabolism, carbon fixation and synthesis of chlorophyll. However, in excess it reduces water uptake and limits enzyme production. It is rare to find excessive Sodium in bowls or golf root zones unless recycled waste water is used for irrigation. Excess Sodium may be counteracted with Mycorrhizal fungi which limit plant Sodium uptake; releasing free Calcium in the root zone or applying Calcium as Calcium sulphate Gypsum CaSO4 or Calcium chloride
Sulphur (S)
Sulphur is an essential turf grass nutrient. It has a role in many enzymes and is involved in carbon fixation, photosynthesis and plant defence. Low Sulphur levels produce chlorosis of younger leaves. Sulphur is only taken up by the plant as Sulphate SO42-, but microbial activity is necessary for the conversion. Many fertilisers contain Sulphates. Sulphur is very mobile within the rootzone. If Sulphur levels are high it suggests poor drainage is allowing Sulphur to build up. In the absence of oxygen toxic sulphides may form. Increased aeration and microbial activity to flocculate soils and convert Sulphur to plant available Sulphate is recommended. Greens where there is excessive thatch build up and water-logging will often smell of Sulphur (eggy) when you take a sample out.
Iron (Fe)
Iron is taken into the plant in Fe2+ and Fe3+ forms. Iron is used in protein functions, as a catalyst and for respiration and photosynthesis. It is also used in plant defence because it binds tightly to proteins rendering them inaccessible to pathogens. Iron deficiencies result in chlorosis of young leaves. High levels of Iron can build up in rootzones and have fungicidal effects, which create root breaks and compaction; reducing the ability to grow perennial grasses and degrade thatch. Excessive soil Iron may lock up P, K, Mn and Cu. If your Iron reading is high, it’s time to make a change to a more natural greenkeeping program that focusses on soil health and micro-life promotion.
Trace Elements
Boron
Boron plays an important role in the development and growth of new plant cells. Boron has a role in chemical and physical plant defence; cell wall lignification and increased toxicity of phenols and stimulation of the hypersensitive response. Boron is required in very small quantities, but can be applied using liquid Boron if necessary.
Zinc (Zn)
Zinc assists chlorophyll production and carbon fixation. Plants use Zinc as part of the defence mechanisms and is a catalyst for enzyme production. It has reduced availability in alkaline soils and soils with high available P, Mg, Cu, Bo and Fe. Zinc is found in seaweed and in zeolite minerals and may be applied in liquid solution using a Liquid Zinc product.
Manganese (Mn)
Manganese is important for the production of chlorophyll, photosynthesis, enzyme functioning and the plant defence mechanisms. It is used in the production of inhibitory compounds, phenolics, phytoalexins (hormones which act much like our own white blood cells do when our body is under attack from disease, injury or infection) and physical plant defences. It is often deficient in sandy and alkaline soils. Leaf chlorosis in new growth is a sign of Manganese deficiency and low Manganese is sometimes implicated in the occurrence of Take All patch. Manganese is also found in Bowls Central Zeolite and in our Liquid Manganese solution.
Copper (Cu)
Copper plays a part in enzymatic processes and is important in use of Nitrogen within the plant. Copper assists in root growth and plant defence mechanisms; physical and chemical. Copper is fairly immobile in soil and activation is dependent upon microbial activity in soil organic matter. Copper is found in Liquid Seaweed, Zeolite and is available in liquid solution too.
Silicon (Si)
Silicon is considered a quasi-essential element and is vital for plant growth and health. Silicon provides structural, physiological and protective properties to plants which are subjected to stresses e.g. cold, wind, poor nutrient uptake and disease. Silicon promotes plant defence mechanisms against pathogens and physically strengthens cell walls. Silicon is less available to plants at high pH and / or low soil moisture.
The Value of a Greens Soil Analysis
Traditionally, the greens soil analysis report has been something to glance at once a year and then file away, which is good to some degree, because it is a very useful reference tool for monitoring trends in your green over the long term. However, it can be much more than just a fertiliser sales tool for your suppliers, which unfortunately it has become for too many clubs.
If you routinely get a greens soil analysis done , but you aren’t seeing improvements in the sward composition, disease resistance or playing performance of your green, maybe it’s time to dig a little deeper and really start to understand what your greens soil analysis report is telling you.
Soil Analysis Services
Why not let Bowls Central arrange your next soil analysis for you. All of our tests are carried out by an independent, professional soils lab.
You will receive a comprehensive, interpretative report written by a Master Greenkeeper with all of the follow up support you need to apply the findings to improve your greens.
Just click the button on the test you want and we will get the process started immediately.
See my Full Range of Soil Analysis Services Here
Questions and Comments Welcome
Of course, if you have any questions, comments, revelations, light bulb moments or observations please get in touch by any of the usual means. I look forward to hearing from you.
I recently received my Soil Analysis, very comprehensive
The results and explanation are easy to understand and point the way ahead to correct any deficiencies.
As an analytical chemist the description of pH is one of the best non scientific descriptions I have ever seen.