Home » localised dry patch » Page 4

Tag: localised dry patch

Doing Nothing vs Trojan Horses

With the end of the bowling season in clear sight, many clubs will have acquired a familiar temporary feature over by the roadside hedge somewhere. If you look closely there will probably be a pallet or five of bagged top-dressing, ready to go on the green as part of the autumn renovation program.

The bags might be plain or they might be covered in text and graphics proclaiming all of the benefits for your turf that are held within.

They are essentially Trojan Horses, in that they appear to be bearing good news and gifts, but they are actually full of sand (up to 90%) and represent the continued insistence of many clubs and consultants to pursue a program of desertification of bowling greens in the UK.

When your green was first constructed, it probably had an 8-10” (200-250mm) deep layer of topsoil (rootzone). An average bulk density for topsoil would be around 1.6 tonnes/m3. If we say that the average green is 36m X 36m we get an area of 1296m2. The volume of soil required to fill this is calculated thus:

 1296 X 0.25 = 324m3

Using our bulk density average of 1.6 we can calculate weight of soil required as follows:

324 X 1.6 = 518 Tonnes. So our average green was built using approximately 518 tonnes of topsoil.

Most hollow tining operations can penetrate the soil to 4 inches (100mm) and this is usually used in conjunction with top-dressing. This then means that top-dressing operations have been concentrated on about 40% of the actual soil used to build the green (the top 4 inches). 40% of 518 tonnes is 207 tonnes.

30 years of top-dressing with 5 tonnes of material each time is equal to applying 150 tonnes of highly sandy material and this disregards the soil being removed by the hollow tiner! This also assumes that your club only jumped on the train to la la land in the 1980’s; many have been at it for at least a decade before that. I also know of some greens where they are routinely throwing 10 tonnes of straight sand on every year, so these figures are only averages and are probably leaning towards the less crazy end of the spectrum.

Is it any wonder then that greens suffer from localised dry patch, excessive thatch build up, powder dry inert soil, compaction, disease, low microbe populations etc, when almost all of the top 4 inches of the green has been replaced by sand?

If this is the plan for your club this autumn it would be better for your green, if you just do nothing. Yes, even neglecting the green and failing to undertake any autumn renovation would be much less harmful to the long term health and performance of the green than following this program.

The great top dressing hoax

Top dressing with high sand content composts has become a tradition in bowling green maintenance but it is far from beneficial.

  1. After 3 decades of routine top-dressing most greens are “inert” and can’t support a population of beneficial soil microbes.
  2. Soil microbes break down thatch and release nutrition to the turf.
  3. High sand and thick thatch usually result in Localised Dry Patch which is a long lasting, devastating condition that causes the soil to repel water.
  4. The surface smoothing and levelling actions of top-dressing are massively over-sold and of very little relevance to producing a smooth, fast green.
  5. Most bowling green irrigation systems are inadequate to start with, but are completely useless in the face of localised dry patch.

The process of top-dressing a bowling green has become so ingrained in our maintenance practices that it is hard to find a club that doesn’t do it, but over the decades it has devastated a huge number of greens in the UK.

Do your green and your wallet a favour and break the habit this year.

Act now on green dry patch

LDP, localised dry patch on bolwing green
spring is a critical time for LDP management

If your green has suffered the blight of localised dry patch (LDP), sometimes called bowling green dry patch in the past, this is the most critical time of the year to take action to minimise the chances of another outbreak.

It’s unlikely that you will be thinking about irrigation of the green just yet, but dry weather in March and April, usually accompanied by drying winds which cause further moisture loss from the green surface can allow LDP to take a firm grip on the green.

The main effects of this might not show up until June, but the damage will already be done and no amount of irrigation will correct this once it has taken hold.

With this in mind and especially if your green has suffered in the past, you should at minimum be keeping an eye on your water balance chart and making irrigation applications to replenish any deficiencies, even if it seems counter intuitive…trust your water balance sheet!

Now is also a good time to mini-tine the green and apply a granular wetting agent, making sure it is washed into the tine holes thoroughly.

Monthly liquid wetting agent applications should also commence now and the water balance sheet (not Charlie, the club champion in 1977, who doesn’t believe in watering greens!) should rule the roost as far as irrigation decisions are concerned.

Much more on LDP here.

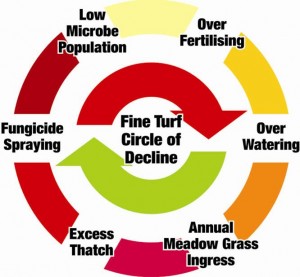
The Circle of Decline—why many bowls greens never improve.

The diagram below shows the process that many poorly maintained bowling greens experience over a period of years if 3 basic maintenance issues are not addressed as a priority.

The top 3 issues on all fine turf are:

1. Thatch Control

2. Compaction Control

3. Turf Nutrition

the Circle of Decline, the reason many greens never improve

In addition to the top 3 there are of course other important issues such as irrigation management, topdressing etc, but if these 3 big issues are under-managed then the green will spiral into what I have called the Circle of Decline.

Simply put this is the course of events that go on largely un-noticed by many bowling clubs until it is too late to effect a quick recovery.

A lack of attention to thatch build up (see other posts under the thatch category) results in a thick mat of un-decomposed  dead grass shoots, roots and leaves. This mat gradually effects the turf’s ability to put down roots and take up water and nutrients. In advanced cases a root break will occur and Localised Dry Patch is a very common symptom of excessive thatch also (see other posts under the LDP category)

Disease

In winter, thatch can hold water like a sponge and encourage fungal diseases such as fusarium patch to take hold. This sometimes results in over use of chemical fungicides which kill off the disease and many beneficial fungi into the bargain.

Symbiosis

Grass relies on beneficial microbes, such as fungi to make best use of the available nutrition and so begins to have difficulty obtaining the necessary nutrition from the soil.

This often results in over fertilisation, as much of what is applied is not made available to the plants due to the anaerobic conditions which now prevail.

By now conditions are highly favourable to the weed annual meadow grass which is a very shallow rooting species. The finer fescue and bent grasses are compromised and in an effort to keep the meadow grass alive excessive irrigation is required.

This contributes even further to the excessive thatch layer as meadow grass is a prolific producer of thatch and we are back to the beginning of the cycle.

Action must be taken to break into the circle of decline, take action before its too late for your green.

Investing in Irrigation-can you afford not to?

Irrigation: cost or investment?

Previously we talked about some of the reasons commonly put forward for not watering bowling greens. I also shared with you, my amusement that so many clubs fail to mention irrigation or lack of it when looking for an explanation for the poor quality or condition of their greens; even though it’s very obvious. They will use just about every other aspect of bowling green maintenance as a reason for poor performance.

Now we come to the cost of irrigation; and I am not talking about the cost of installing a system, but merely the cost of the water being applied on any given night.

This is another big reason or excuse that I hear a lot about:

“we can’t water any more because it costs a fortune”

Now of course there will be variations (slight) around the country and also from system to system, but here is my 10 second rundown on the cost of water for irrigation:

  • As we saw previously a typical system will put out 1mm of irrigation water for every 2 minutes of system run time.
  • A typical system will also put out 150 litres per minute; so to calculate the cost per mm of irrigation we do this:
  • 2 (minutes) X 150 (litres) X 4 (sprinkler heads) = 1200 litres/mm

That’s to achieve 1mm over the whole green.

As 1200 litres is 1.2 m3 you simply have to multiply the irrigation requirement in millimetres by your cost per m3 and then by 1.2

Example:

  • Water balance sheet shows we need to replace 15mm of moisture loss.
  • Multiply 15 (mm) X 1.2 (m3) X £/m3
  • 1.2 (m3) X £0.90 = £1.08/mm of irrigation over entire green.

I’ve used 90p as an average cost, but you can find your own local charge on your water bill or by phoning the water company.

The question is whether you see irrigation as a cost or an investment in the future of your green.